iolite Essentials has just been released, and represents a great new tool for labs with fewer processing requirements. iolite v4 remains our flagship application, and will continue to lead the way in time-resolved data processing. Given the different feature sets, how do you know if Essentials is right for you or your lab? This article explores the differences between the two. There is a table listing the differences at the bottom if you want to skip to that.
Key Differences
Laser Log File Requirement
All experiments in Essentials require a laser log file to determine when each sample was measured and what type of sample it was (e.g. reference material vs unknown). If your laser system does not produce laser log files, you will not be able to create images in Essentials, and you’ll find it quite difficult to process your data.
Conversely, iolite v4 has several tools for working with datasets without laser log files (e.g. automatic selections from channels etc).
Image Analysis
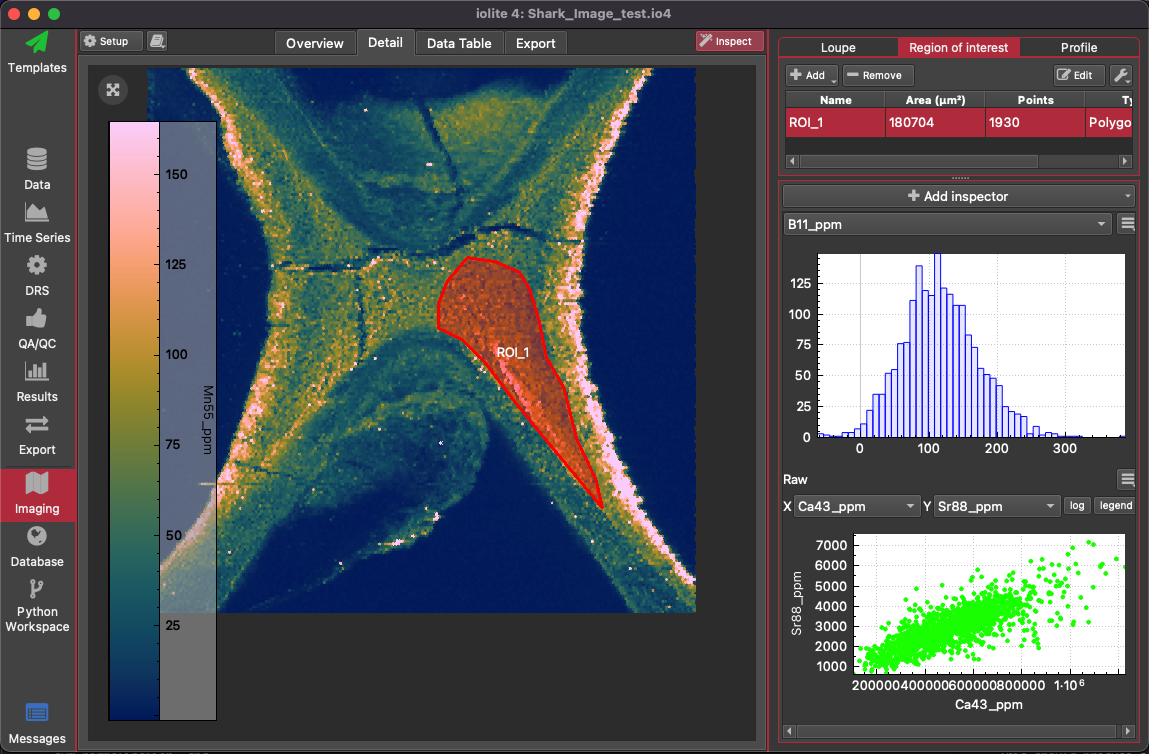
Both iolite v4 and Essentials can create images. However, iolite v4 has advanced image analysis capabilities such as regions of interest (ROIs), image profiles, and image inspectors that plot image data in a variety of ways (e.g. histograms, density plots, REE plots etc).
While Essentials can create images, it does not have any image analysis features, and is an separate module that can be purchased with Essentials, and as mentioned above only works with datasets containing a laser log file.
Note also that Essentials cannot process images using the “From Selections” approach that is included in iolite v4.
LIBS data
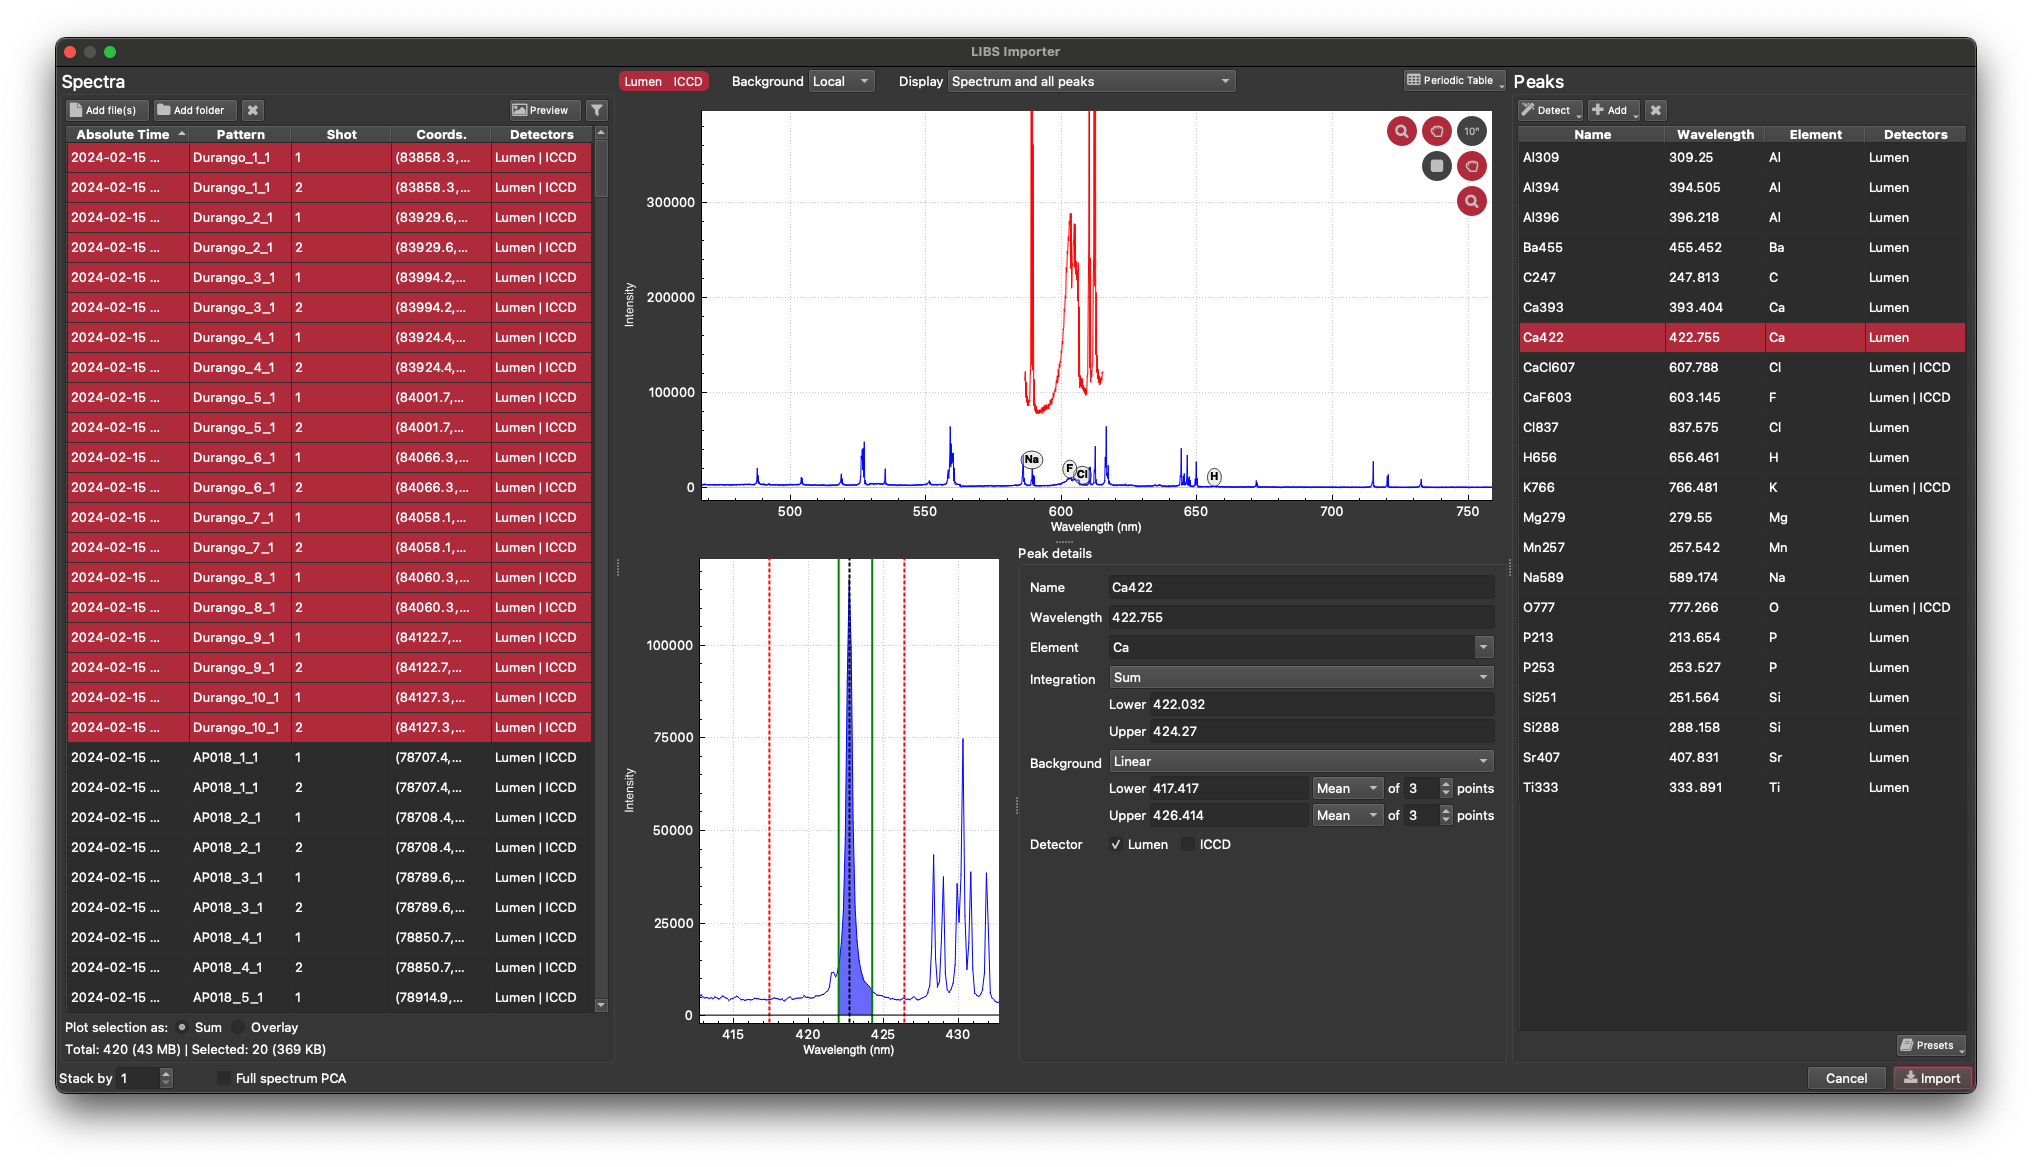
Only iolite v4 has LIBS import functionality and allows the analyst to select LIBS peaks (spectral windows) and treat the data in time-series, just like LA-ICP-MS data. LIBS data can then be used to create images, including the image analysis features described above.
Essentials cannot process LIBS data.
Geochronology
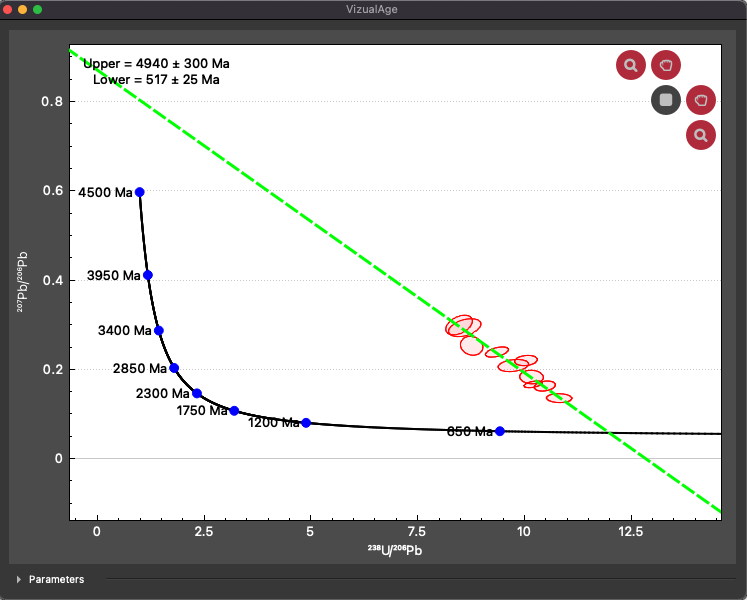
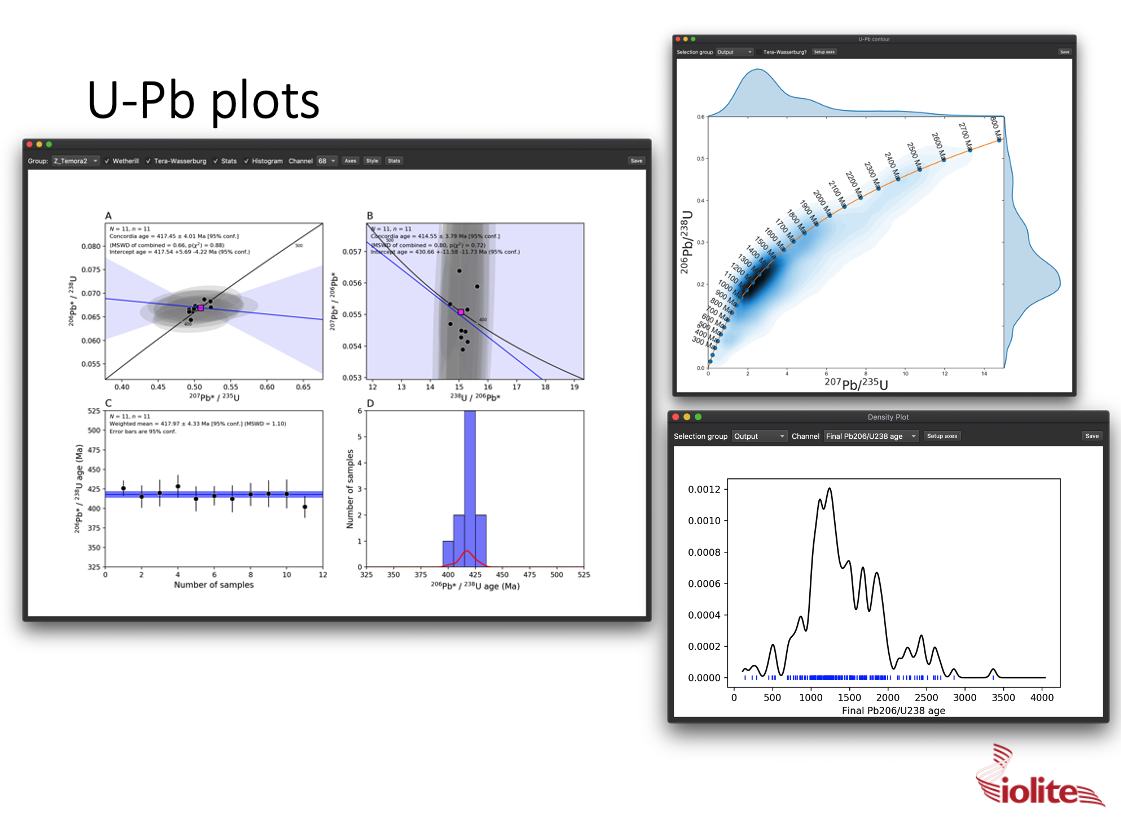
iolite Essentials can process basic U-Pb datasets and includes a live (Wetherill) concordia plot similar to iolite v4’s VizualAge. However, this functionality does not account for common-Pb bearing minerals (e.g. apatite, titanites etc) which would normally be processed in iolite v4’sUComPbine Data Reduction Scheme.
iolite Essentials can only process U-Pb datasets for zircons.
Similarly, Rb-Sr, Hf isotope, Sr isotope, Pb isotope etc datasets are not handled by Essentials. However, with iolite v4’s Python API, any dataset can be processed, and many custom and community data reduction schemes are available on GitHub.
Advanced Trace Element Concentration Calculations
iolite v4 comes with the most sophisticated trace element processing available. This includes:
- 3D calibration surfaces to account for changing sensitivity over time with multiple reference materials
- downhole fractionation corrections
- sum normalisation, and
- affinity corrections
Our open access peer-reviewed paper describes these features, some of which were first developed by, and are unique to, iolite.
Essentials has an optional 3D Trace Elements module for those processing multi-reference material experiments. This module includes 3D calibration surfaces and sum normalisation, but not downhole fractionation corrections or affinity corrections.
Split Stream Experiments
Split stream experiments are those where the stream of particles coming from the laser ablation cell are split and sent to two different mass spectrometers. Processing these experiments is simple in iolite v4: the Data Syncer tool synchronises the data from the different mass specs so that you can directly process the data as if it was coming from one mass spec. It also allows you to visualise changes in samples with channels from each mass spectrometer (e.g. U-Pb ratios from a quadrupole, with simultaneous Hf isotope ratios from a multicollector).
Essentials does not include tools for split stream experiments.
Customisable Visualisation tools
iolite v4 includes many tools for visualising your data. iolite’s tag line for many years was “See your data. Know your data” as the relationship between being able to visualise your data in a variety of ways and truly understanding what’s happening with your samples is very closely linked. iolite v4 includes a flexible and customisable Time Series View that plots each channel in your experiment including everything from raw data through to output results. Additionally, iolite v4 allows you to plot one channel against another (X-Y plot), box and whisker plots, correlation matrices, and plotting of summary statistics for each sample, as well as many others. iolite v4 also comes with the Custom Plot tool that allows the analyst to create journal quality custom plots from any data within an experiment (including metadata such as measurement time etc). And for ultimate flexibility, iolite v4 comes with a Python API that includes the ability to plot anything using the incredibly comprehensive MatPlotLib.
Essentials includes adjustable time-series plotting for a single channel at a time, summary stats for each channel, and live concordia plots for U-Pb geochronology, as described here.
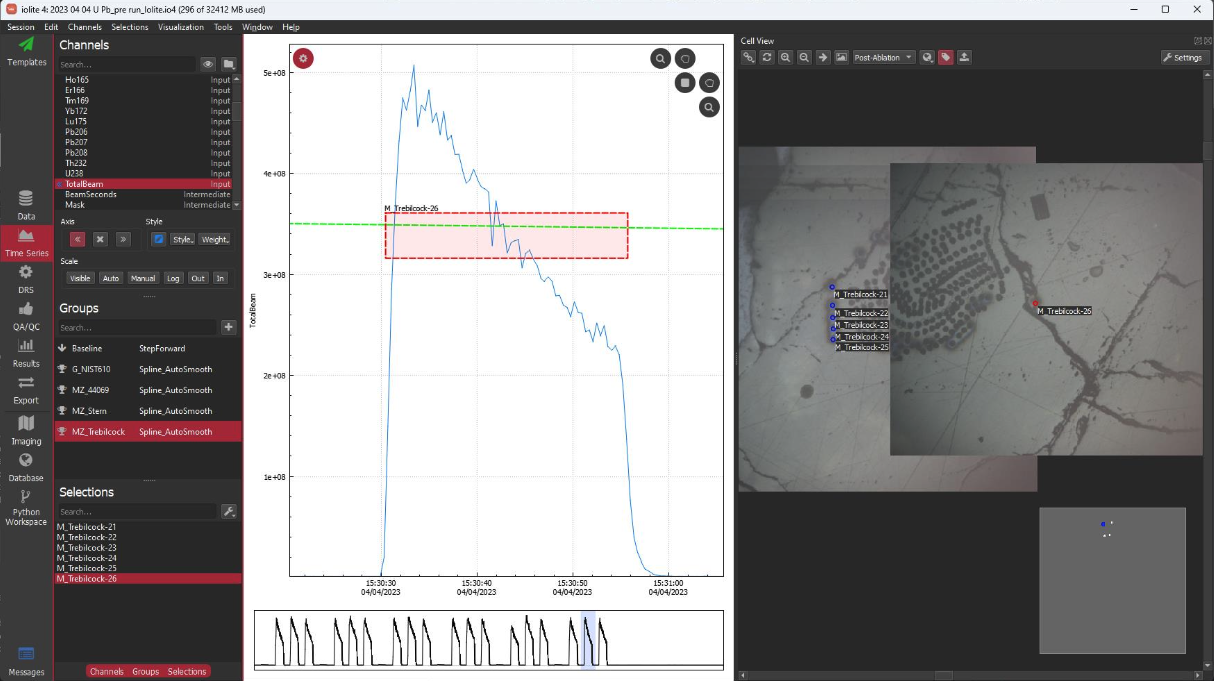
An example of iolite v4’s advanced visualisation tools is shown below where time series data can be correlated with post-ablation images. This allows the analyst to determine if anomalies in the time-series data can be correlated with features in the post-ablation images (such as fractures etc). This example is a split-stream U-Pb, Hf isotope and trace element spot analysis dataset.
Python API
iolite v4 has a unique Python API that means you can create your own plugins, such as custom import modules, data reduction schemes, exporters, QAQC modules and much more. iolite’s Python API provides the iolite community with the platform to create any tool it requires. Examples of community tools created using iolite’s Python API are available on GitHub. There is also an 8-week course on creating custom tools for iolite using python available online here.
iolite Essentials does not have a Python API and cannot use tools created by the iolite community.
Summary
While iolite Essentials provides solid basics for processing LA-ICP-MS data, there are many features that are only in iolite v4. Although the major differences between the two packages have been listed here, there are other minor differences. If you have any questions about which package would be most suitable for your lab, please contact us at iolite@icpms.com.
| Feature | iolite v4 | iolite Essentials |
|---|---|---|
| Datasets without laser log files | ✔ | ❌ |
| Basic single-RM trace elements | ✔ | ✔ |
| Multi-RM trace elements | ✔ | ✔ |
| Sum normalisation | ✔ | ✔ |
| Advanced trace elements tools | ✔ | ❌ |
| Basic image creation | ✔ | ✔ |
| Image Analysis | ✔ | ❌ |
| LIBS data processing | ✔ | ❌ |
| Basic U-Pb geochron | ✔ | ✔ |
| CmPb U-Pb geochron | ✔ | ❌ |
| Rb-Sr geochron | ✔ | ❌ |
| Hf Isotopes | ✔ | ❌ |
| Sr Isotopes | ✔ | ❌ |
| Pb Isotopes | ✔ | ❌ |
| Split-stream experiments | ✔ | ❌ |
| Customisable visualisation tools | ✔ | ❌ |
| Python API | ✔ | ❌ |