A common question we are asked about U-Pb geochronology in iolite is:
“Why is the mean age calculated by iolite different to the age calculated from the mean ratio?"
This post will most likely be too simple for the more math-literate, but I’m breaking it down for those like myself that enjoy seeing these sort of concepts explained in detail. I have included a spreadsheet showing all the calculations detailed in this note that you can download from here.
If you are more math-literate, or would like a more general explanation of this effect, I recommend reading the Wikipedia entry on the Jensen’s Inequality.
Lets use 207Pb/235U ratios/ages for our example, but the same applies to other ratio/ages. In the question above, the “age calculated by iolite” refers to the mean of the Final 207Pb/235U age, and is asking why this is different to the age you might calculate from the mean of the Final 207Pb/235U channel. This is due to the non-linearity of the age calculation. Just to remind you, here is the equation for calculating an age from a 207Pb/235U ratio (the equation for 206Pb/238U is very similar but uses a different constant):
$$\text{age (Ma)} = \frac{\ln(\frac{207}{235} +1)}{0.00098485}$$
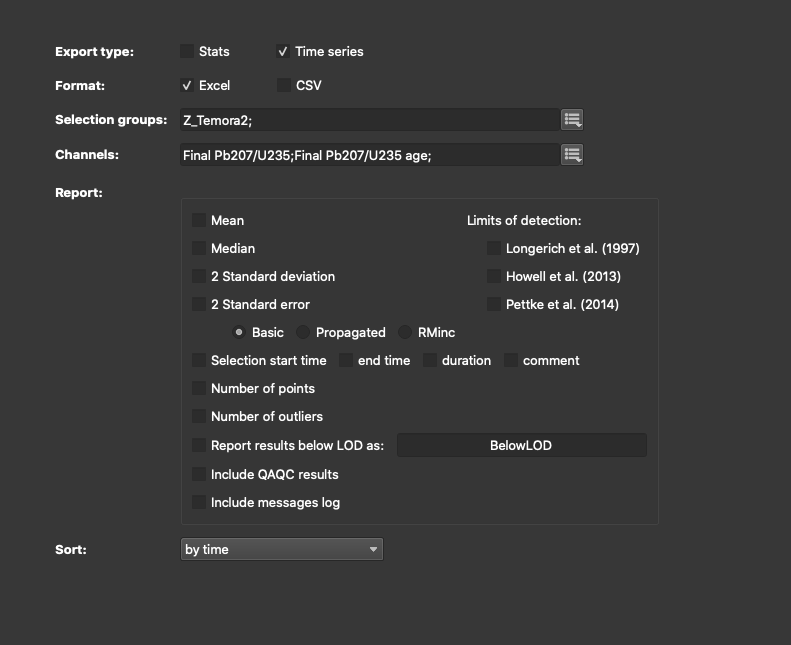
the natural log part is quite important, because that tells us that the equation is non-linear. We can demonstrate that with a simple example. I’m going to take one of the selections from our U-Pb example dataset DRO4.io4 that can be downloaded from here. In particular, I’ve picked the third selection of Temora 2, but any selection would have done. I exported the Final 207Pb/235U and Final 207Pb/235U age values for the entire selection as a time series (so that I could see each value rather than just the mean for each channel). You can do this yourself in iolite v4 by using export settings shown below:

If you open the resulting Excel file, you’ll see a worksheet for each selection in the Z_Temora2 group. I’ve already created a spreadsheet showing the calculations described in this Note, and removed the other unused worksheets, that you can download from here and check through to satisfy yourself.
Now if we calculate the mean of the Final 207Pb/235U ratios in our spreadsheet, we get a value of 0.503. If we were to use the age equation above, that would give us an age of about 413 Ma which pretty close to the accepted age of Temora 2 – 417 Ma. However, if we calculate the mean of the Final 207Pb/235U age values, we get a value of 409 Ma: the ages are not the same. This is the crux of the question at the top. Why aren’t these values the same?
The first thing we could look at is the effect of varying our ratios. Let’s add 20% to the mean ratio value (0.503) and calculate an age from these two new ratios:
| Offset | Ratio | Calculated Age (Ma) | Difference (%) |
|---|---|---|---|
| -20% | 0.400 | 342 | -17% |
| +20% | 0.600 | 477 | 16% |
In this table, Difference (%) is the difference between the newly calculated age and the age from the mean ratio (0.503) of 413 Ma. So you can see that if we have a value 20% lower than the mean ratio, it will result in a 17% lower age, and if we have a value 20% higher, our calculated age increases by 16%. Let’s exaggerate this a little further, and increase our differences to 50%:
| Offset | Ratio | Calculated Age (Ma) | Difference (%) |
|---|---|---|---|
| -50% | 0.250 | 227 | -45% |
| +50% | 0.751 | 569 | 38% |
So, here we can see the effect even more: the lower ratio has moved the calculated age down 45%, but the higher ratio has only moved the calculated age up by 38%.
Hopefully this helps demonstrate that lower ratios pull down the calculated age more than higher ratios pull the calculated age up. And 50% isn’t even that abnormal when talking about the variation we might see in Final 207Pb/235U ratios: even our example Temora 2 data vary by 67% (2 RSD).
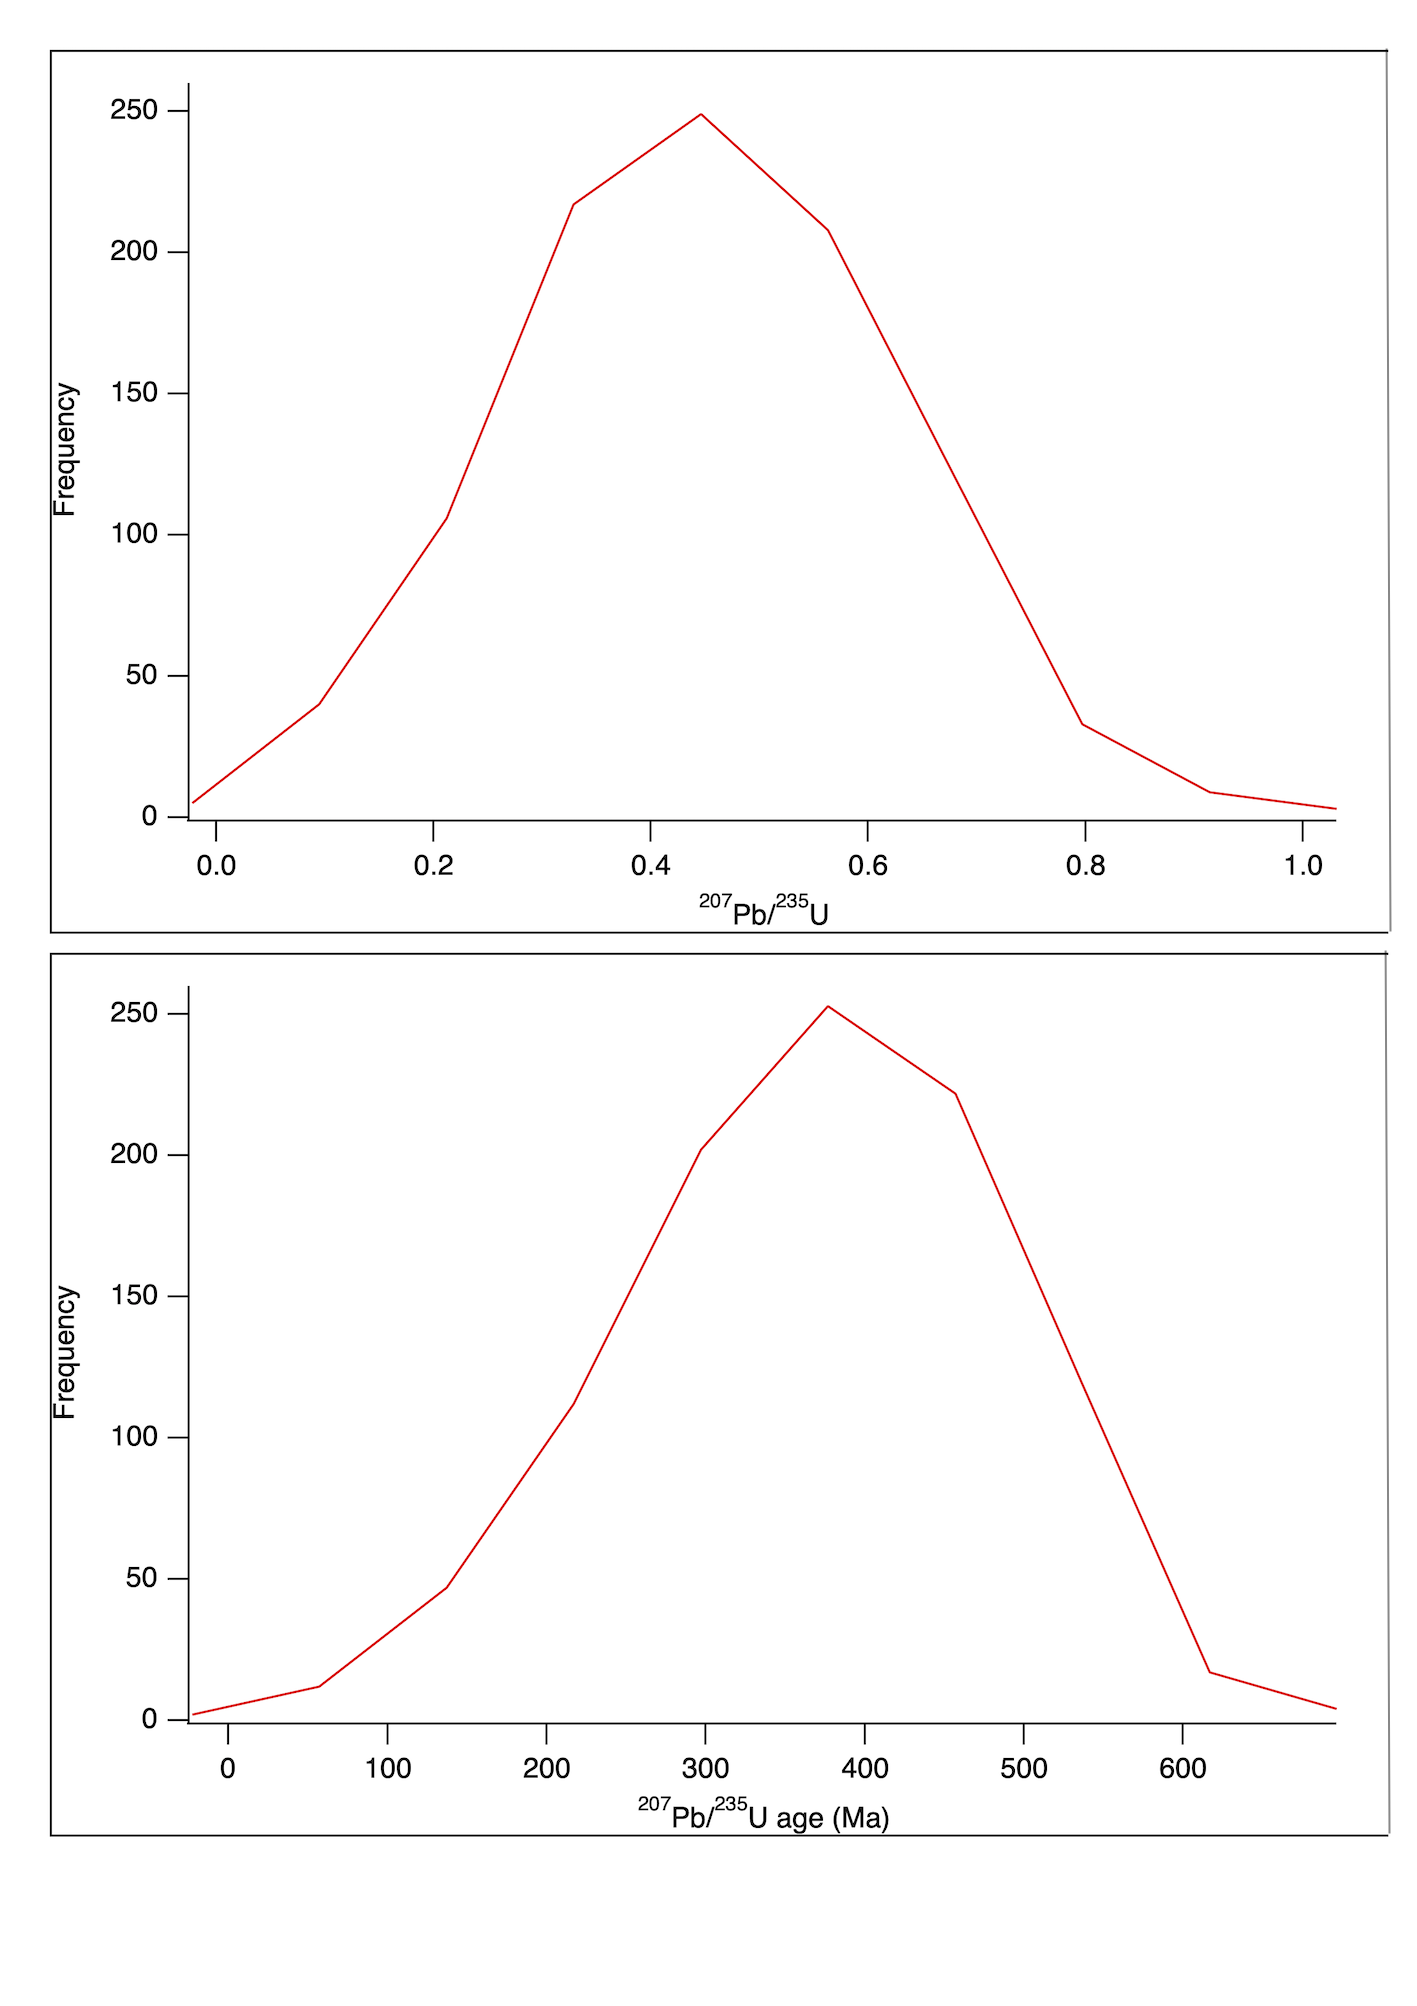
And just to show that this isn’t related to the distribution of ratios in our example dataset, let’s look at a perfectly normally distributed set of ratios# with the same mean (0.503) and standard deviation (0.169) (see the spreadsheet linked above for the ratio values). If we put each of those ratios into the age equation, we end up with a negativley-skewed group of ages, because of the non-linearity of the age equation.

We have a skew to the negative side of our distribution of ages, even though we had a normal (gaussian) distribution going into the age equation. And this is why if we calculate the mean of these ages we get a different value to if we calculated an age from the mean ratio.
So, which value to use? We recommend that you use the mean ratio, and calculate an age from this. The ages that iolite shows are more to help you understand your data and to provide context, rather than actually providing an age estimate.
If you have any questions about the above, please join the discussion here.
#The values in the spreadsheet are not *perfectly* normally distributed, because they are a random subset of 1000 values from a normal distribution, but they are a good approximation. The values you see will likely not quite match the same values I see because Excel will create a new sample of 1000 values when you open the spreadsheet, but the principle is the same.