In iolite 3, sessions were saved as Igor Pro “packed experiment” pxp files. This was convenient because iolite 3 was built on top of Igor Pro. The main downside to this was that Igor Pro pxp files cannot be easily read by most 3rd party software. In iolite 4, sessions are saved as files with an “io4” extension. However, this extension is just for show as the data format of the file is actually HDF5. This is super convenient because many scientific data analysis and plotting packages support the HDF5 format.
As an example, let’s go through how you can load data from an iolite 4 session file into Igor Pro to be plotted.
Making Igor Pro aware of HDF
Igor Pro comes with all the tools to enable HDF interaction but it does not enable them by default. To enable Igor’s HDF functionality (for Igor Pro 8 64bit, others may differ):
- Go to the Help -> Show Igor Pro Folder menu item.
- Go to the Help -> Show Igor Pro User Files menu item.
- Navigate to “More Extensions (64-bit)/File Loaders” in the Igor Pro folder, find “HDF5-64.xop” and copy it (or make a shortcut to it).
- Paste “HDF5-64.xop” in the “Igor Extensions (64-bit)” folder in the User Files folder.
- Navigate to “Wavemetrics Procedures/File Input Output” in the Igor Pro folder, find “HDF5 Browser.ipf” and copy it (or make a shortcut to it).
- Paste “HDF5 Browser.ipf” in the “Igor Procedures” folder in the User Files folder.
- Restart Igor Pro.
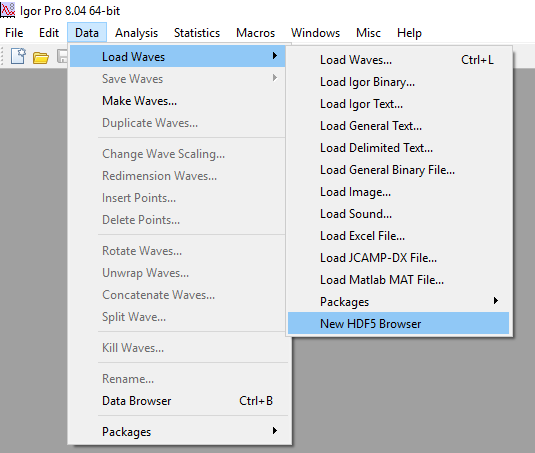
That’s it. You should now be able to access the HDF data browser by going to the Data -> Load Waves -> New HDF5 Browser menu item in Igor Pro.

Importing some data
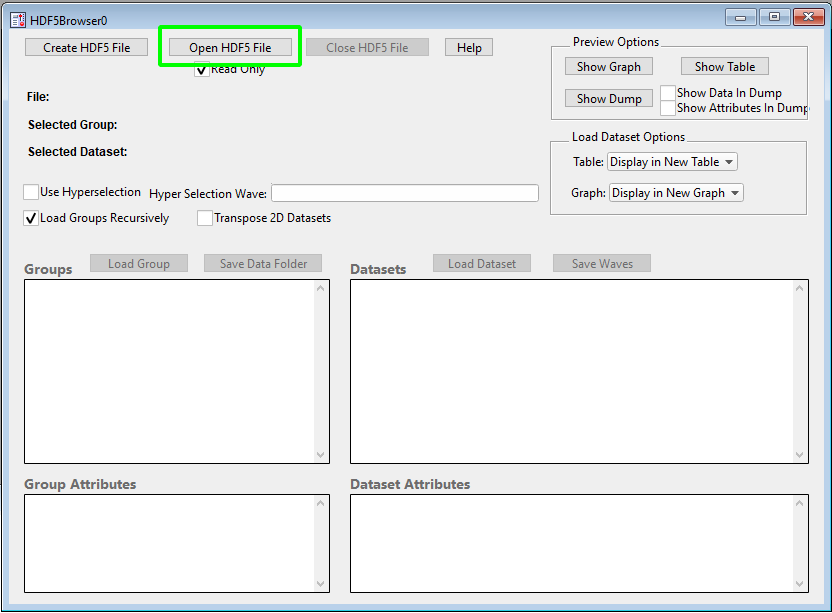
When you activate the “New HDF5 Browser” menu item, you will be greeted by a dialog that looks as follows:

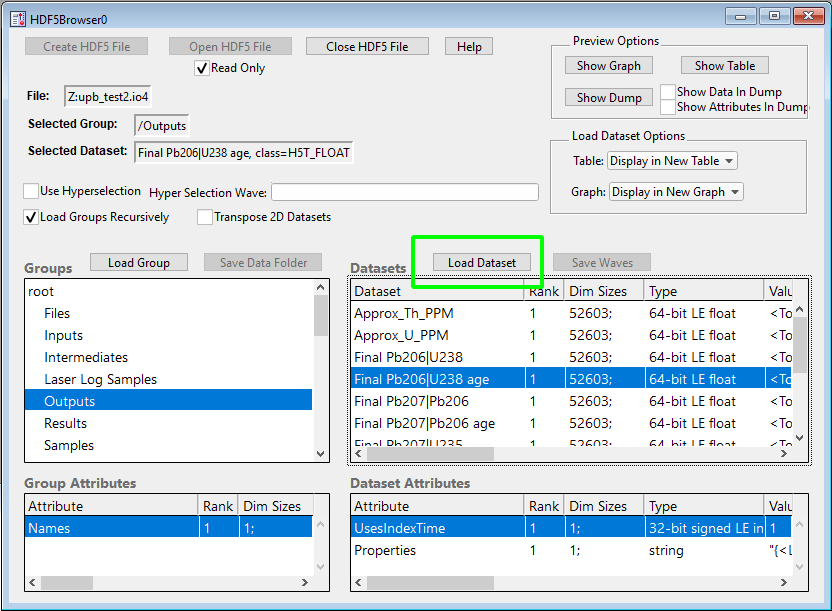
To start, we click the highlighted “Open HDF5 File” button and select the iolite 4 session file we want to get some data from. Once the file is loaded, you can navigate the various groups on the left and datasets on the right. Once you have found a channel you want to plot, you can select it and lick the “Load Dataset” button highlighted below.

You may need to repeat this process a few times to get all the channels you want loaded into Igor Pro. Also note that some channels use “IndexTime”, which you can find in the “Special” group.
Adjusting the time
Igor and iolite handle time a bit differently. If it matters to you that the time axis is the true value, you’ll want to adjust it as follows (e.g. in the Command Window - Ctrl+J or Cmd+J):
IndexTime += Date2Sec(1970, 1, 1)
Making a plot
Now that you have the channel and time data loaded, you can make a plot in the usual Igor Pro way. You can start by going to the Windows -> New Graph menu item and selecting the time as X and the channel as Y. I chose one of the final age outputs to plot and made some adjustments to the style:

Click here to discuss.