Using laser logs to help sort out what’s what in your data files is a significant time saver. Now, with iolite 4’s python API (see here and here for more info) you can do even more with your laser data!
Accessing laser data in python
The key is data.laserData(). This function returns a python dictionary or dict for short. That dict has keys corresponding to each log file that has been imported. The values associated with the file keys are also python dicts, but this time there are several keys, such as ‘x’, ‘y’, or ‘width’, and those keys are associated with data arrays.
As an example, we can get the laser’s time and x position as follows:
 1
 2
 3
 4
 5
 6
 7
 8
 9
10
|
laser_data = data.laserData()

# Since I don't want to write out the log file path, we can look that up
log_file = list(laser_data.keys())[0] # The first log file (0 = first)

 x = laser_data[log_file]['x']
 x_time = x.time()
 x_data = x.data()

 # Now you can do stuff with that data!
|
This is great, but the laser log’s time is not the same as our normal data channel time. To get the laser data on the same time frame as our normal channels we can use NumPy to interpolate it on to our index time.
1
2
3
4
5
6
|
import numpy as np

index_time = data.timeSeries('TotalBeam').time()
x_data_ontime = np.interp(index_time, x_time, x_data)

# Now you can do stuff directly comparing laser data and channel data!
|
We can take things one step further and actually create channels for each of the laser data arrays as follows:
1
|
data.createTimeSeries('Laser_x', data.Intermediate, index_time, x_data_ontime)
|
The beauty of this approach is that now the laser data can be treated like any other channel in iolite. You can visualize the data in the Time Series view, and you can also export results for selections on those channels.
Putting it all together
 1
 2
 3
 4
 5
 6
 7
 8
 9
10
11
12
13
14
15
16
17
18
19
|
import numpy as np

ld = data.laserData()
index_time = data.timeSeries('TotalBeam').time()
laser_params = ['x', 'y', 'state', 'width', 'height', 'angle']

for param in laser_params:
    laser_time = np.array([])
    laser_data = np.array([])

    # We will iterate through each of the main laserData keys and
    # concatenate the arrays to handle the case where multiple logs
    # have been imported
    for ld_key in ld.keys():
        laser_time = np.concatenate([laser_time, ld[ld_key][param].time()], axis=0)
        laser_data = np.concatenate([laser_data, ld[ld_key][param].data()], axis=0)

    interp_data = np.interp(index_time, laser_time, laser_data)
    data.createTimeSeries('Laser_%s'%(param), data.Intermediate, index_time, interp_data)
|
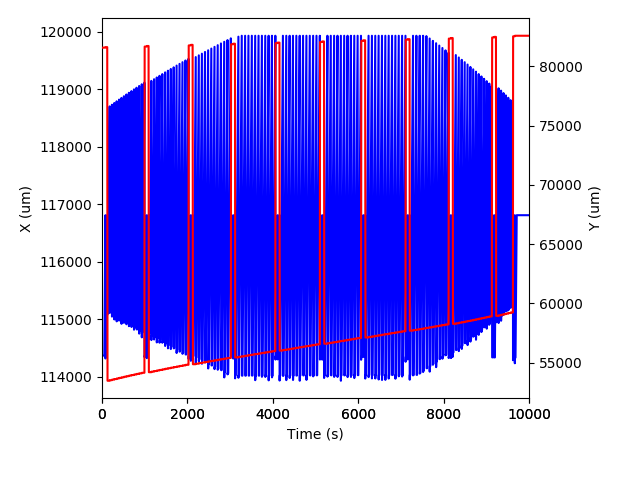
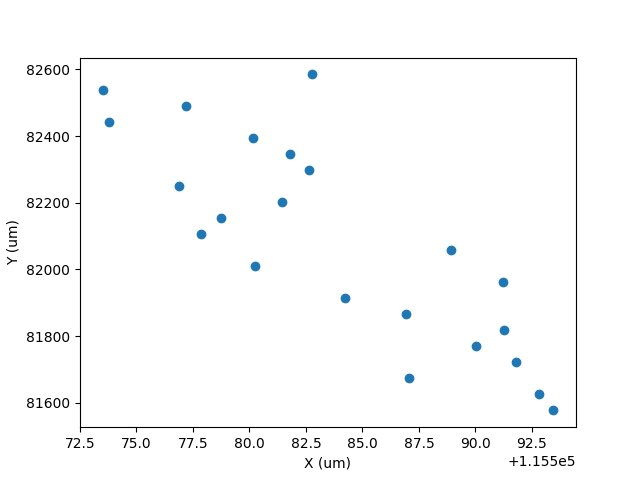
Having a look at some laser data
 1
 2
 3
 4
 5
 6
 7
 8
 9
10
11
12
13
14
15
16
17
18
19
20
21
22
23
24
25
26
|
import matplotlib.pyplot as plt

# Get data
x = data.timeSeries('Laser_x')
y = data.timeSeries('Laser_y')

fig, ax = plt.subplots()

# Plot X
ax.plot(x.time() - x.time()[0], x.data(), 'b-')

# Plot Y on right
ax2 = fig.add_subplot(111, sharex=ax, frameon=False)
ax2.yaxis.tick_right()
ax2.yaxis.set_label_position('right')
ax2.plot(y.time() - y.time()[0], y.data(), 'r-')

# Labels
ax.set_xlabel('Time (s)')
ax.set_ylabel('X (um)')
ax2.set_ylabel('Y (um)')

ax.set_xlim( (0, 10000) )
fig.tight_layout()

plt.savefig('/Users/japetrus/Desktop/laserdata.png')
|

 1
 2
 3
 4
 5
 6
 7
 8
 9
10
11
12
13
14
15
16
|
import matplotlib.pyplot as plt

# Get data
laserX = data.timeSeries('Laser_x')
laserY = data.timeSeries('Laser_y')

group = data.selectionGroup('G_NIST610')

x = [data.result(s, laserX).value() for s in group.selections()]
y = [data.result(s, laserY).value() for s in group.selections()]

plt.plot(x, y, 'o')
plt.xlabel('X (um)')
plt.ylabel('Y (um)')

plt.savefig('/Users/japetrus/Desktop/xy.png')
|

Click here to discuss.

