Masks have been part of iolite since the early days, but we still regularly get questions about them. In this note, we will take a look at what a mask is and why you might want to use one, the ways you can make one, and what it looks like when things go right (and wrong).
What is a mask
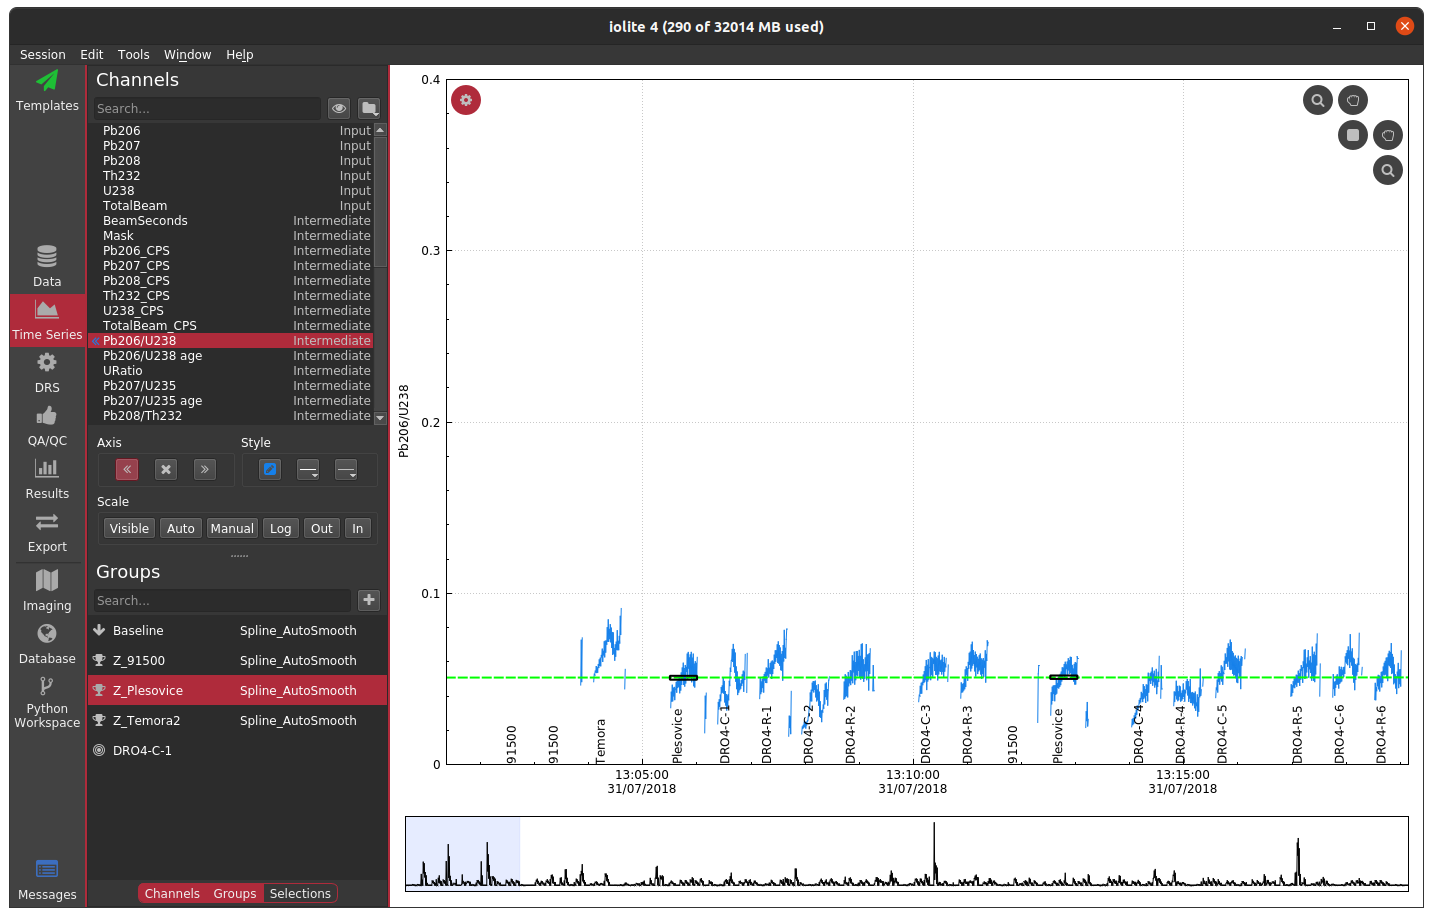
Often when working with mass spectrometry data there are intervals in the time-resolved signals that don’t correspond to a sample being analyzed. In these intervals, calculated channels, such as ratios, will sometimes behave erratically making it difficult to see the part of the signal that corresponds to your sample. For example, see below where I have not used a mask and am plotting the time-resolved 206Pb/238U for a series of zircon analyses.
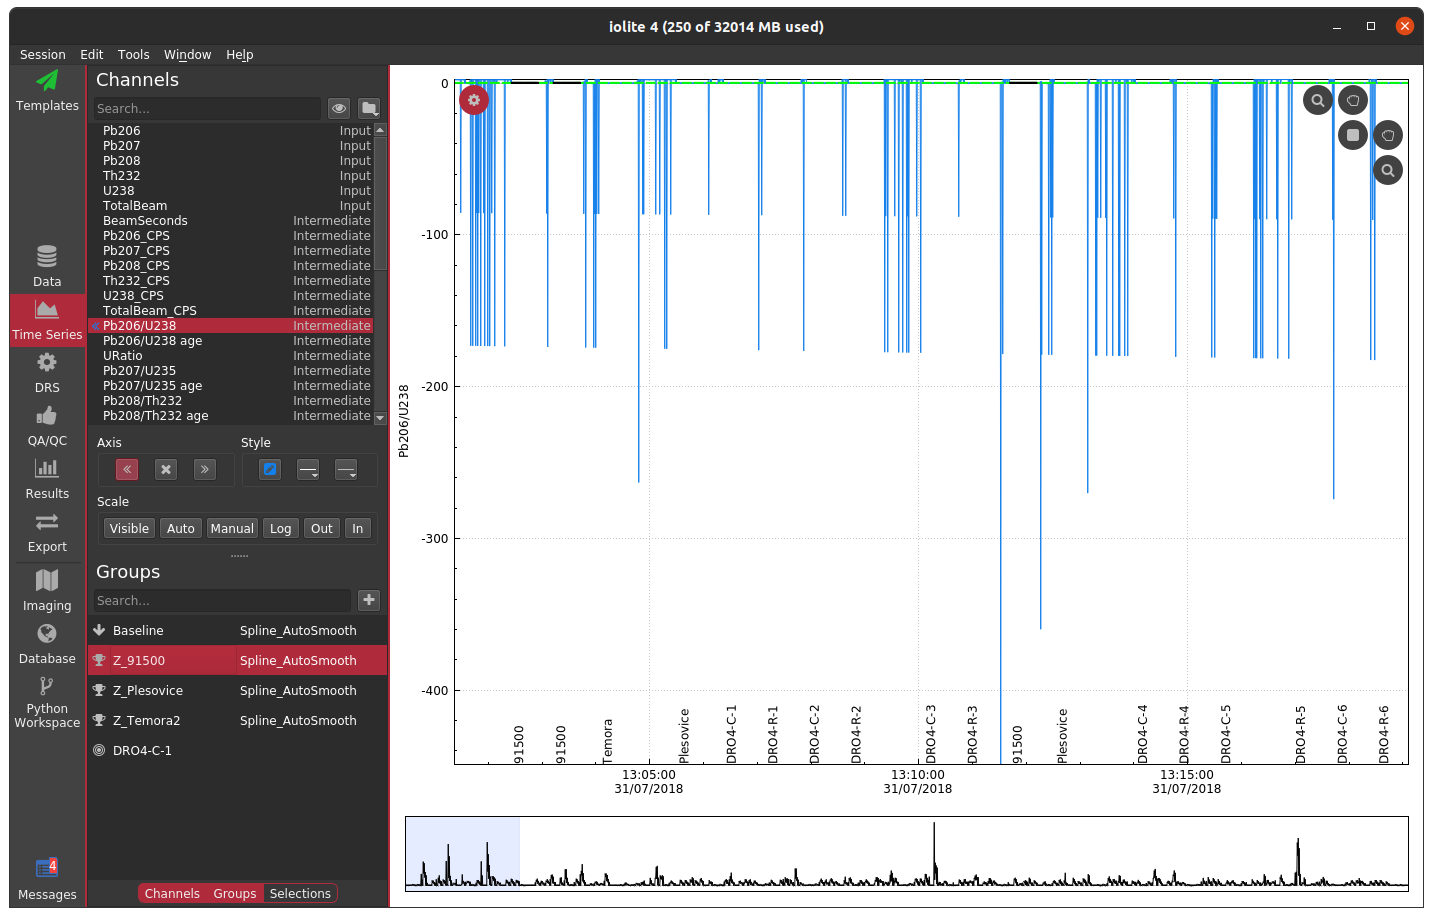
In this plot, the 91500 zircon analyses are relatively close to 0 and are relatively invariant, but since we have not applied a mask, the background regions for the ratio are strange and confuse the auto scaling. For most data reduction schemes, the backgrounds of input channels are removed (thus bringing them close to 0) and therefore calculating things like ratios is especially problematic due to dividing by very small numbers. In the above example, apparently one of the input channels’ baseline subtraction resulted in the data being slightly below zero, which caused the ratio in the background to be large and negative. We could, of course, just zoom in on the relevant data as below.
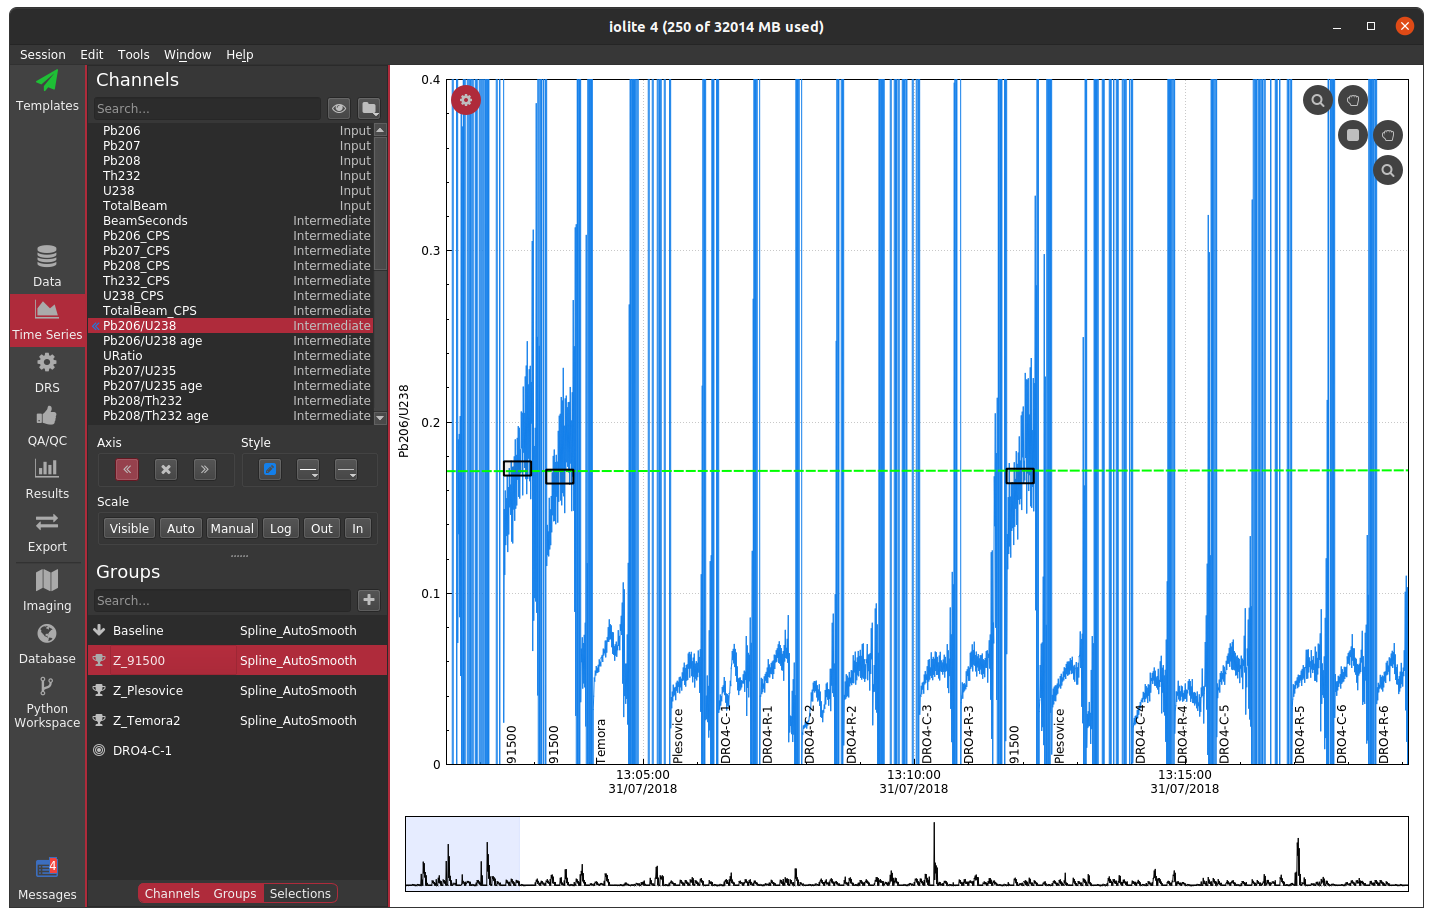
However, this is a bit unsightly and makes it difficult to see trends in the time-resolved data. A more elegant solution is to mask (i.e. hide) parts of the channels that we don’t want to see. In terms of the math happening behind the scenes this is equivalent to multiplying a channel’s data by an array with ones where we want to see data and nans where we don’t. The mask, however it is determined, is typically applied to all calculated channels (i.e. intermediates and outputs).
It is also worth mentioning that data that have been masked will not contribute to a result. In other words, if a selection extends into masked data, the masked data do not figure into the mean, uncertainty, etc.
How to create a mask
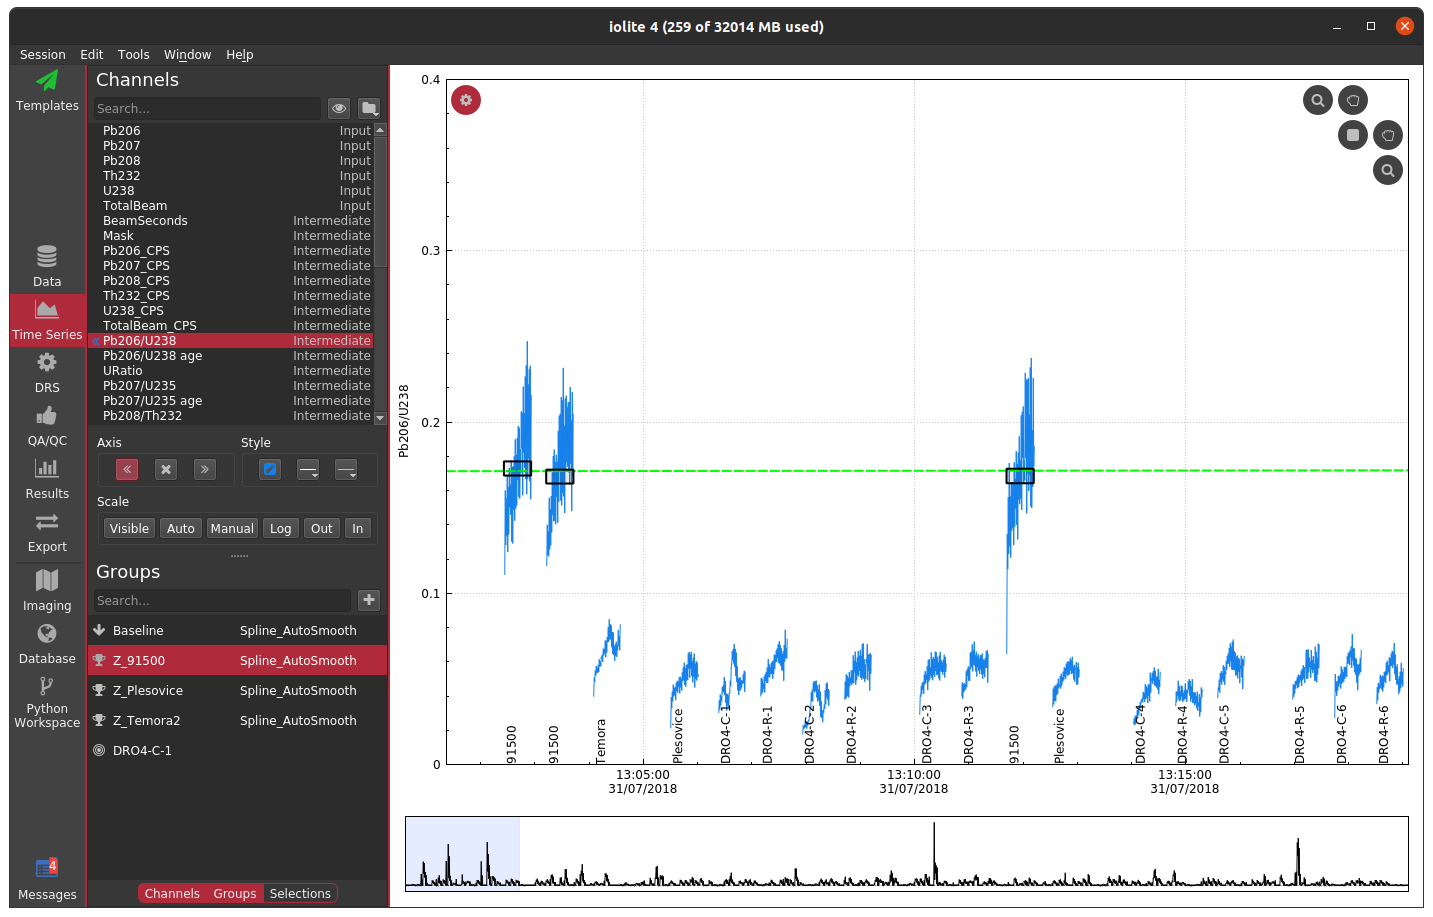
There are two ways commonly used to create a mask in iolite. The preferred method is to use a laser log. From the laser log we know when the laser is firing and therefore know when to expect useful signals. We can use this information to construct a mask that will block out all other parts of the data in calculated channels. You can see the effect of using the laser log to construct a mask below where we no longer see the chaos between samples and can now focus on individual and long term trends.
If you do not have a laser log, you can alternatively construct a mask by using an input channel and cutoff threshold. The best channel to select and specific value to use ultimately depends on the nature of your data and which channels you have analyzed. In this zircon dataset, if I were to choose U238 and a cutoff of 500 CPS, the masked data looks as below.
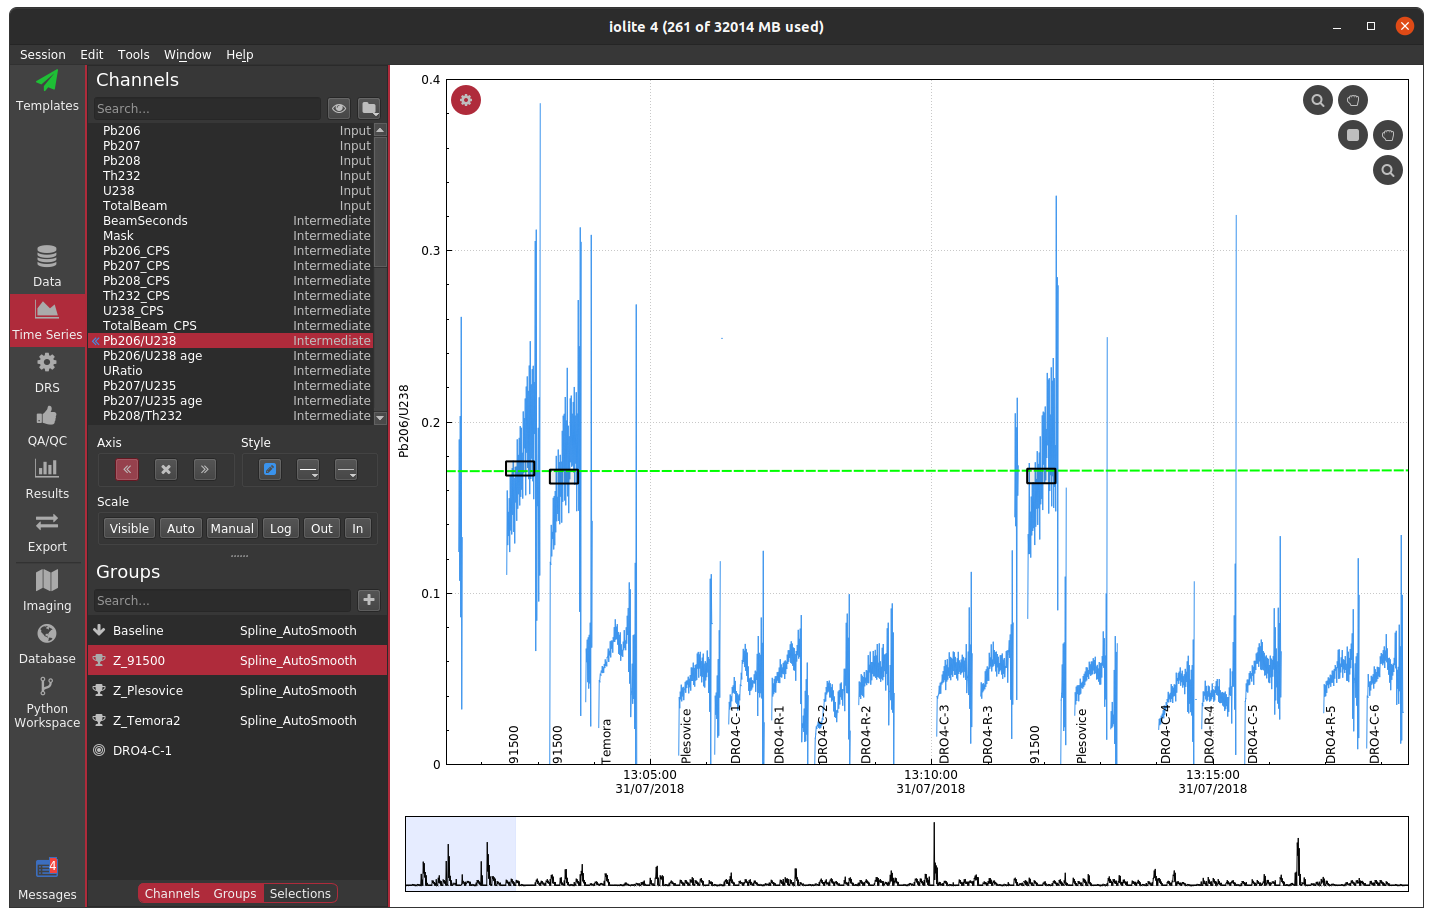
If you compare the two carefully, you can notice that the cutoff used probably left a bit too much signal at the beginning and end of each spot. You could try fiddling with the channel or cutoff values to fix the issue, or you can opt to trim the mask by a configurable number of seconds at the beginning and end of each change. If we were to select a trim of 2 seconds, you get the following.
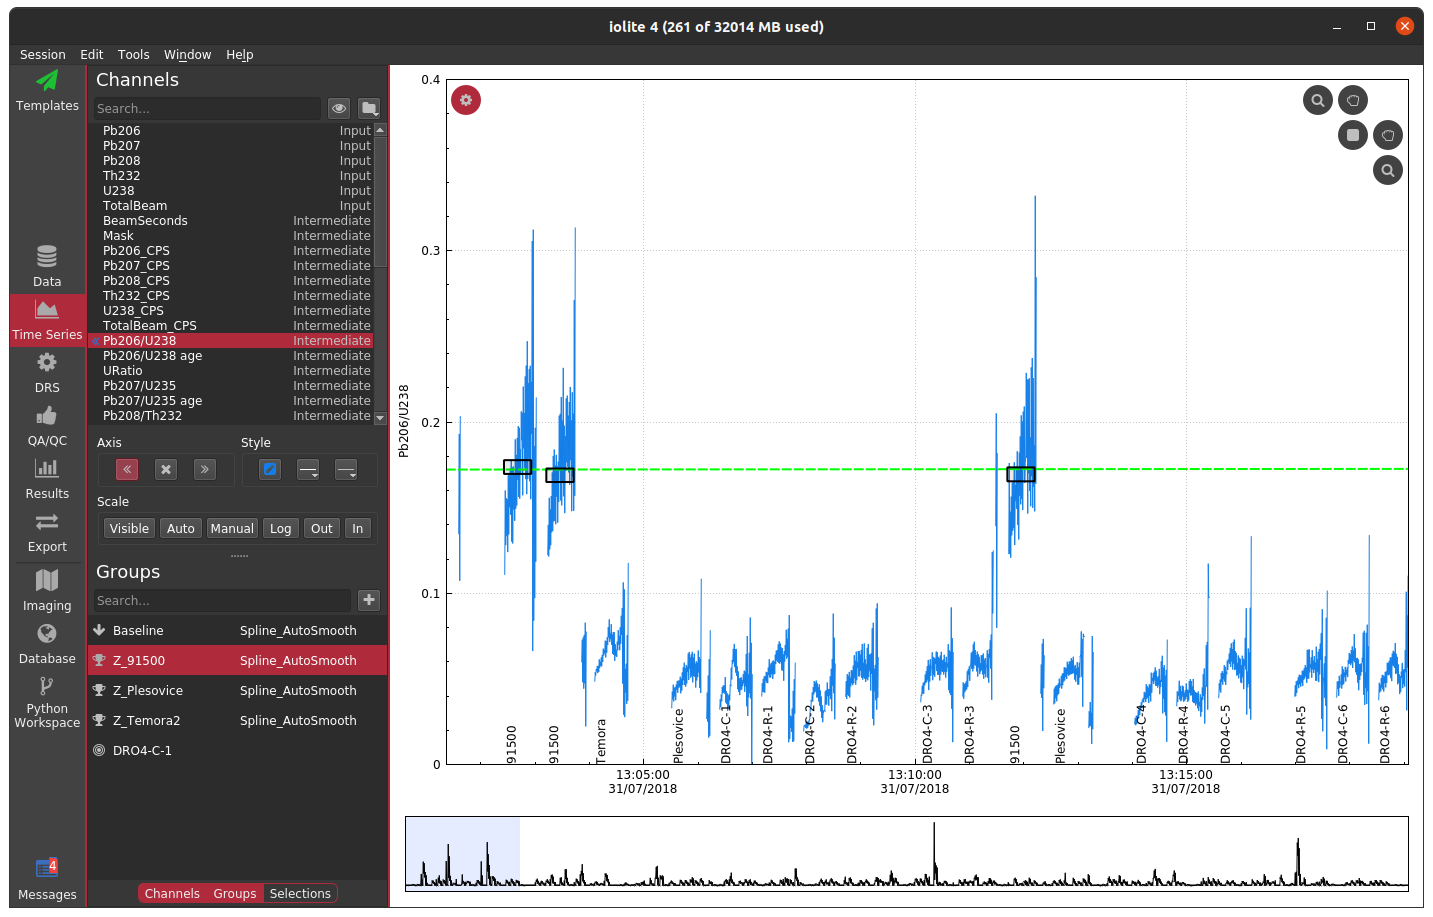
Note that the ends in particular still look erratic. The reason for this is that there are cleaning pulses between analyses that cause the U238 signal to spike and therefore the mask does not apply there. Examples like this demonstrate why a laser log is preferred – they are more accurate and take the guess work out of the process.
When things go wrong
Of course, there are a variety of ways things can go wrong. A few examples of what to watch out for are shown below.
Laser log not aligned properly
If the laser log is not aligned to the data properly, you can end up with a mask that masks part of the good signal and doesn’t mask part of the baseline (or worse), as shown below.
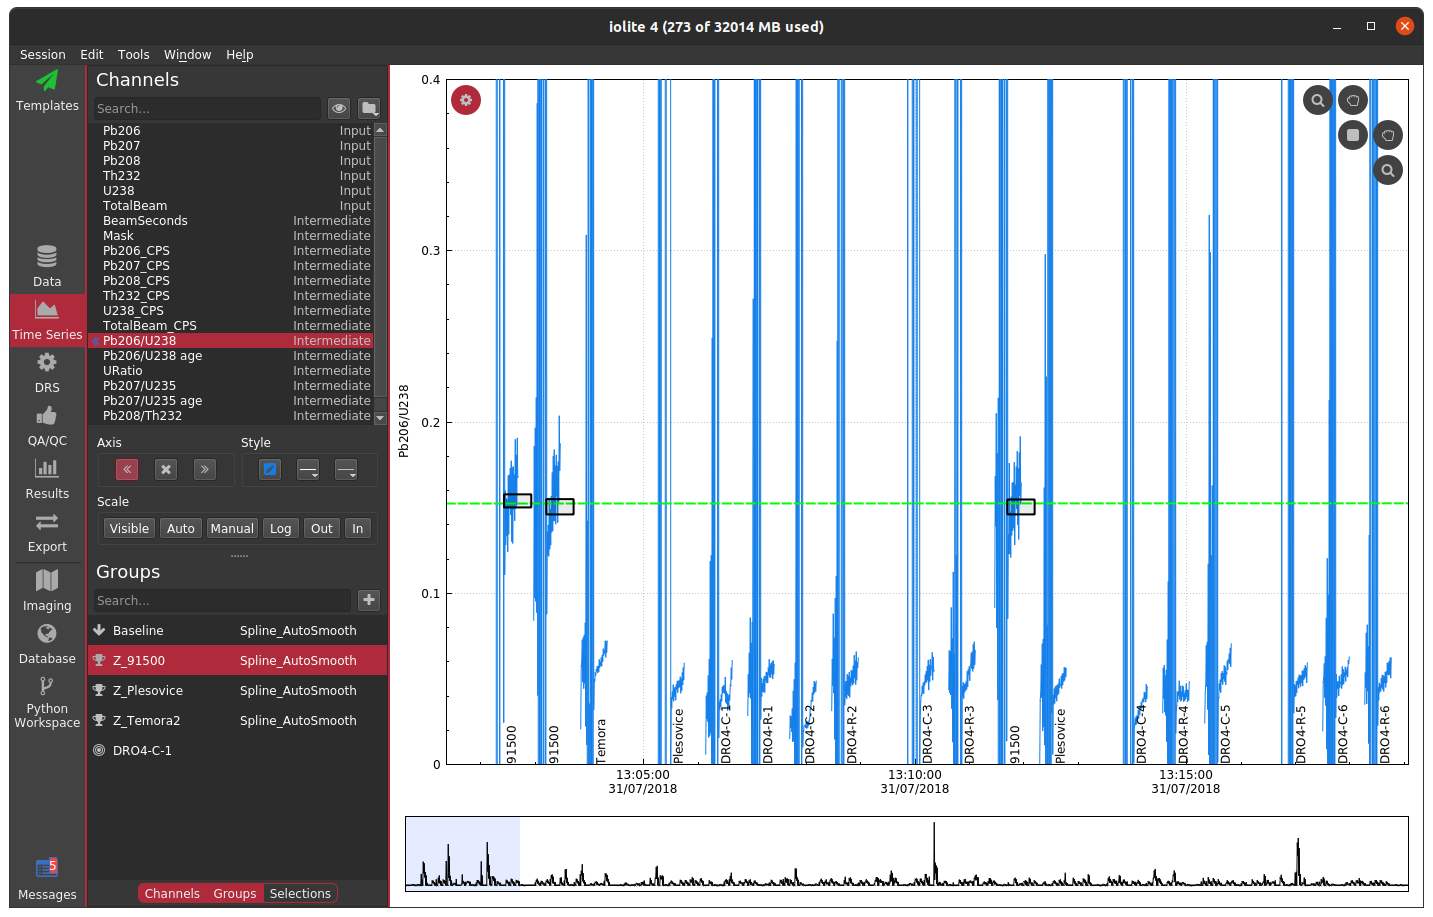
For U-Pb datasets, a misaligned laser log will also be evident in the down-hole fractionation plots if you are using the laser log for the beam seconds method.
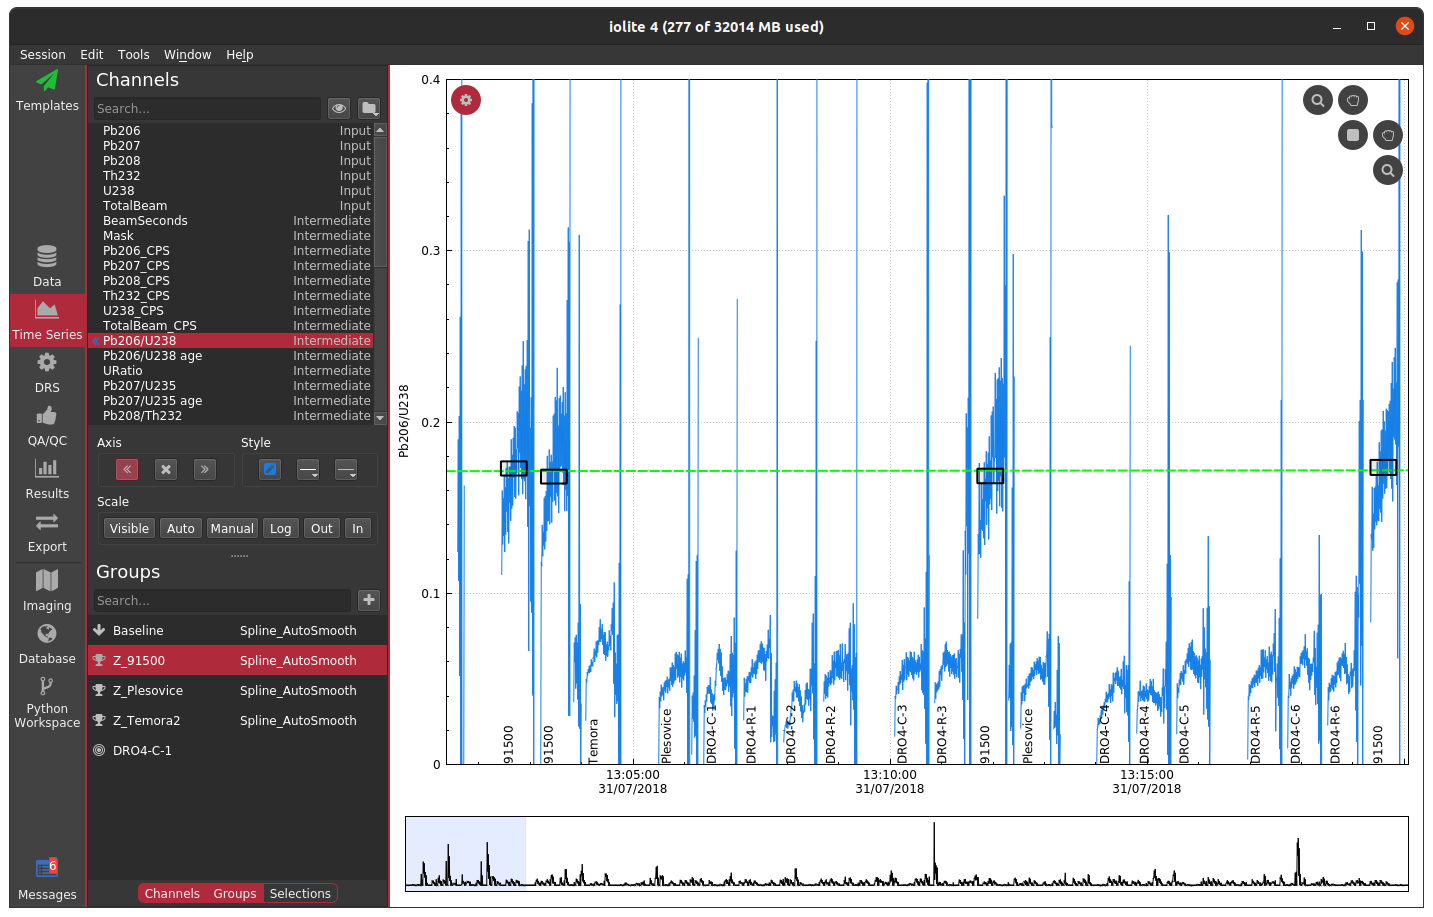
Cutoff too low
If you specify a cutoff that is too low, you can end up with something that looks like no mask at all (e.g. as above), or some intermediate.
Cutoff too high
If you specify a cutoff that is too high, you can end up with all of the data masked, which may lead to other complications and/or errors depending on which data reduction scheme is in use.

Channel not consistent
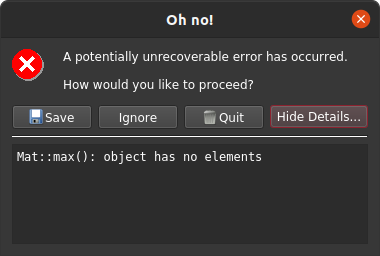
It is also possible to specify a channel and value cutoff combo that totally masks some analyses and not others. For example, in this zircon dataset it is possible to completely mask the relatively low U 91500 zircon analyses while leaving the others alone by using an intermediate U238 cutoff. If we were to do that and select 91500 as our reference material, this would produce an error as below because the data reduction scheme cannot find any data to do the correction with.
If you were to use a different reference material with same mask configuration you would find something as below, where the data corresponding to 91500 appear blank.
Thank you for reading! Click here to discuss.